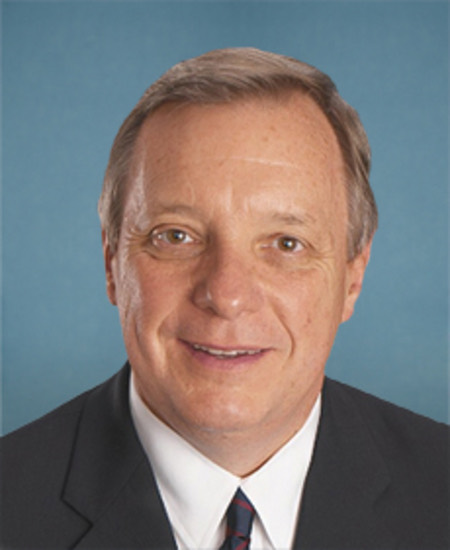
Senate Minority Whip · U.S. Senator, Illinois · Democratic · in the Senate since Jan. 7, 1997
GPO · public domain
The Executive Summary
Sen. Richard J. Durbin (D–IL) ranks No. 14 of 91 senators on this site's legislator rubric — the published list of what a grade is made of and how much each part counts, set before any grade was computed and identical for every senator — built on the 100% of the rubric that can be measured today. Because a senator's constituency is the whole state, Illinois's outcomes on Durbin's watch place them No. 42 of 78 senators ranked that way. In the 119th Congress, Durbin has missed 2.7% of recorded votes — 24 of the 897 roll calls the Senate printed their name on, above the 2.1% median for sitting senators, and the 42nd-highest rate of 100. Durbin is recorded on 29 tracked major laws: for 26, against 2, not voting on 1. In the 119th Congress, Durbin has sponsored 135 bills and resolutions, spread across 26 of the Congressional Research Service's topic labels; the two largest groups are Crime and Law Enforcement (19 of 135) and Health (17 of 135). A filing label is where the Research Service shelves a measure so it can be found again — it says what a bill is about as filed, not what it did — and sponsoring is not passing. Durbin is Senate Minority Whip — the floor-leadership posts move the chamber's bills rather than sponsor their own, so a sponsorship count reads differently in that job; this site carries the note on every floor-leadership page, majority and minority alike. Every figure is drawn from the cited public record; the full breakdown — including what can't yet be measured fairly — is below.
Graded on 4 of 4 components — 100% of the rubric. The bar below is the whole rubric: each segment’s width is its published weight, its colour is the block’s own score. Hatched slots were not scored, and their weight is held back rather than handed to the blocks we could measure.
Block score:below chamber middleabovenot scored — no evidence, not a score of zero
Rubric component
Weight
Block score
Into the grade
Illinois: how the state moved on their watch
33%
−0.20σ
−0.066
Bills they move (LES, 118th Congress)
40%
+1.14σ
+0.456
Fiscal votes (CBO-scored laws)
13%
+0.61σ
+0.081
Attendance (missed votes)
13%
0.00σ
0.000
Grade — the measured parts, added up
−0.066 + 0.456 + 0.081 + 0.000 = +0.471
100% counted
+0.471σ
A hatched slot is not a bad score, and not a zero. It is weight the rubric set aside because the evidence to fill it does not exist yet, and nothing on this page says which way Durbin would have scored on it. That weight is never redistributed to the blocks we could measure, so the σ above is built from 100% of the rubric and two members at the same σ were not necessarily judged on the same evidence. The weights are preregistered and identical for all 91 graded senators — this measures a record against a fixed rubric, not a person’s worth or effort. Block scores print to two decimals as they do everywhere on the site and contributions to three, so multiplying a printed score by its printed weight can land a thousandth off the row beside it; the last column is the export’s own figure, and it is what the total adds. How the grade works →
Richard J. Durbin
U.S. Senator · Illinois · Democratic · in the Senate since Jan. 1997
Illinois outcomes during their Senate service · scored 1999–2025
Category
Latest
Score vs. peers
Education scale score
277.4 ’24
+0.77σ
Air quality AQI
43 ’24
−1.10σ
Water quality % of systems with a violation
5.0 ’25
−0.10σ
Unemployment %
4.6 ’25
−0.58σ
Health coverage % of adults 18-64 uninsured
11.5 ’24
−0.32σ
Tax burden % of personal income
7.2 ’24
−0.78σ
Energy cost cents/kWh
15.9 ’24
−0.04σ
Cost of living index, US=100
100.0 ’24
−0.20σ
Homicide age-adjusted deaths per 100,000
8.7 ’24
−0.67σ
Teen births per 1,000 females 15-19
10.4 ’24
+0.71σ
Wellbeing mean poor-mental-health days of 30
4.3 ’24
+1.41σ
Obesity % of adults
34.2 ’24
−0.11σ
Early literacy % of 4th-graders below basic
40.7 ’24
+0.26σ
Gun deaths age-adjusted deaths per 100,000
12.4 ’24
+0.06σ
Food-aid access index (higher = easier access)
1.1 ’23
+1.47σ
Jobless-benefit access % of unemployed receiving UI
30.1 ’24
+0.50σ
Scoring windows run 1999–2025 and differ by metric — none starts before 1997, the year Durbin entered the Senate. “Latest” is a different year by metric (2023–2025); every row states its own. Each row’s window, source and last-checked date are behind its ? button.
Missed votes 119th Congress only, not lifetime career · “Not Voting” only; “Present” is a recorded position · U.S. Senate roll callsThe roll call records whether a member voted, never why they did not.
2.7%24 of 897 roll calls
Party-line votes share of their Yea/Nay votes cast with their own party’s majority — agreement with their party, not a left-right position · 119th Congress only, not lifetime career · U.S. Senate roll calls
92.9%810 of 872 recorded votes
Promises kept
In human review
A senator’s constituency is the whole state, so they are scored on the same verified state outcomes as the governor — ranked against other senators — alongside their own legislative record. Influence is shared with 99 colleagues and Governor JB Pritzker; the score shows relative movement, not sole credit. Methodology v3.0
The Rundown
No. 14 of 91 senators — on the 100% of the grade we can measure.
Bills that move. A Legislative Effectiveness Score of 1.65 — the scale is set so each chamber averages 1.00, and it counts only the bills a member sponsors themselves and how far each one gets. The grade scores that against members of the same chamber on the same side of the majority, so it reflects lawmaking rather than who holds the gavel: the same score sits differently in the majority than out of it. Measured over the 118th Congress, now complete. Among the 4 Senate floor leaders — the roles whose job is scheduling and moving the chamber's bills rather than sponsoring their own — Durbin's own-sponsorship score ranks 1 of 4 (118th-Congress scores; a thin cell, said plainly), which is the very work this figure cannot credit.
The Congress's output — reported, not scored. The 119th Congress has enacted 102 public laws through Aug. 26, 2026 (govinfo's own listing of enacted laws). That is a count for the whole Congress, not a figure about Durbin: it is carried on all 4 Senate floor-leadership pages, majority and minority alike, because those are the posts that negotiate what reaches the floor. It is reported as context and never scored — a Congress's output belongs to 535 members and a president's signature, not to one gavel.
Fiscal votes. The deficit footprint of the laws Durbin voted for, per CBO's estimates, ranked against other senators with enough scored votes — a lower footprint ranks higher. 7 scored laws today, dollar-dominated by the largest two — one from each party's trifecta — so this measures the 2021–2025 fiscal era more than a career; coverage broadens as laws are added. Every vote and its CBO figure is itemized in the debt section below.
Illinois outcomes. Illinois's own record contributes here — same formula for every senator (v2.6): the trend is fitted only inside Durbin's own 29.7 years of Senate service, blended 40/60 with the state's current condition, and the block is capped because a state is shared with 99 colleagues and a governor. It carries 100% of its full weight here — priced by how much data the window holds, never by who the senator is.
So this is a ranking of 4 things, not a verdict on a career. Senators are also scored on their state's outcomes, ranked only against other senators. Everything reserved above publishes the moment it can be measured fairly, and never before.
When Durbin first entered Congress in 1983, in the House, the federal debt stood at $1.14 trillion (end of fiscal 1982; Treasury). As of 2026-09-17 it is $40.09 trillion (Treasury, daily). That rise spans presidents, majorities and economies — it belongs to no single member, which is why it is context here and part of no grade. What is Durbin’s own: their recorded votes when the major fiscal bills came through, beside what the Congressional Budget Office estimated each law would do to deficits.
Total public debt outstanding, fiscal 1982–present, in nominal dollars — no adjustment for inflation or the size of the economy, so early decades understate their era’s burden. Y-axis starts at zero. Source: Treasury. Shaded spans and dashed marks (dated on the rail below the chart): exogenous events — recessions as dated by the NBER, the COVID-19 emergency as dated by the WHO, and NOAA-recorded $100B+ hurricanes — the outlier years are theirs, not any one officeholder's.
Reading these: a baseline is CBO’s projection of what the government would spend and collect if the law never changed — the measuring stick a bill’s cost is measured against. Choose a different stick and the same law scores differently, which is why CBO publishes more than one and why each figure below carries the basis it was scored on. The differences are in the sticks, not in the arithmetic.
Debt figures as of the data refresh on 2026-09-21. These same votes feed the grade’s fiscal-conduct block (10%, methodology v2.5) — the debt itself feeds nothing: it belongs to no single member, and only their own votes are scored. The change is preregistered and dated in the changelog.
Integrity Record
facts from official records — not a score
No checkable commitment by Durbin has been tested by a recorded vote in the harvested window. This panel holds facts, not a score: what Durbin committed to on the record in words a computer can test, what their name was formally on, and what evenly-bipartisan bodies or courts have found — each line beside the record it rests on. Honesty is not numerically scored on this site; adjudicated findings, when final, cap the grade under a preregistered rule. Read the full rulebook.
1. Checkable commitments
spoken floor pledges a computer can test — window 2026-03-01 to 2026-08-31
No checkable commitment from Durbin compiled in this window. 72 pledge-shaped sentences by Durbin were harvested and excluded with published reason codes (hedged, no named bill, reported speech, and the like) — excluded means the computer could not test it, not that it was broken or kept. A commitment appears here only when it names its own test — a specific bill, in the sentence itself — and the test can be read from a recorded vote or the bill’s official record. Vague promises are listed in the site-wide exceptions feed, never rated.
Transparency context: Durbin spoke ~230,172 attributed words on the floor in this window, with 3.13 pledge-shaped sentences per 10,000 words. Strategic silence is visible here without being scored.
2. Name-vote consistency
formal endorsements vs. final-passage votes, same text only
No qualifying endorsement-vote pair for Durbin in the 119th Congress so far. Qualifying is rare by design: the pair counts only when the text at the vote is essentially the text they signed, and committee amendment breaks that on most bills that reach the floor — every excluded pair is in the public exceptions feed with its reason.
3. Adjudicated record
findings by courts and evenly-bipartisan bodies — the only tier that can cap a grade
Record search: 1 of 6 sources connected — House and Senate discipline votes (roll-call record). Not yet connected: Federal court judgments (deception statutes, ADJ-3 map); House Ethics Committee public reports; Senate Select Committee on Ethics public actions; FEC enforcement (MURs with admission or knowing-and-willful finding); GAO / Inspectors General findings naming members. Within the connected sources, Durbin has 0 qualifying events (as does every member — no adjudication event has scored site-wide). A final Tier 1 finding caps the overall grade at F, Tier 2 at C−, Tier 3 at B — caps only, never bonuses, under preregistered rule ADJ-7.
What this panel measures: matches between Durbin’s formal signed acts, spoken checkable commitments, and the official record — plus findings by courts and evenly-bipartisan bodies. What it does not measure: truthfulness of speech in general, campaign promises, effort that leaves no record, or motive. Items the rules cannot decide from records are excluded and listed, never guessed. Dispute anything: challenge@politicalgrades.com.
These are the major bills this site tracks line by line — not a full voting record. A member casts hundreds of votes a Congress; these 29 are the ones whose spending has been extracted and cited from the enacted text.
Every date links to the official roll call in the chamber where Durbin cast the vote. “Did not vote” is not “absent” — the record shows no vote was cast and gives no reason, which is often illness, travel or a paired vote. Nothing on this table is counted toward or against Durbin’s grade.
These pies aggregate the largest verified spending items — appropriations and mandatory outlays — in the bills Durbin cast a recorded vote on, sliced by category, every dollar quoted from the bill text. Three kinds of dollar are excluded, exactly as on the bill pages: authorizations (permission for a future bill to spend, not money), guarantee ceilings (the government backstopping private loans, no cash out) and pay-fors (the taxes or savings that offset a cost, which is money coming in rather than going out). This shows what the bills contained, by Durbin’s own votes — not a claim that Durbin wrote the spending or that it did or didn’t work. Every dollar in these pies is quoted from the bill text and cited, item by item, on the bill’s own page.
Payments to Health Care Trust Funds — general-fund transfer to the Medicare Supplementary Medical Insurance (Part B/D) trust fund — Centers for Medicare & Medicaid Services$548,130,000,000
Payments to the Medicare Hospital Insurance and Supplementary Medical Insurance Trust Funds (general-fund subsidy) — Centers for Medicare & Medicaid Services$487,862,000,000
recorded on 29 of 30 tracked laws · 135 measures filed
Two different kinds of record sit below and they are not interchangeable. The first is a recorded vote on a law that passed, whose dollars this site has read out of the enacted text and quoted line by line. The second is a measure Durbin filed — a document introduced, which most often goes no further than a committee referral. A vote is not authorship: nothing here says Durbin wrote the spending in any of these laws, and nothing here says the money did or did not work. And a filed bill carries no verified money breakdown at all — this site has read exactly 31 bills line by line, and a measure outside that 31 appears below as a title and a filing label, nothing more.
The tracked laws — Durbin’s recorded position, and where the money went
Recorded on 29 of 30. One law carries no recorded position that the service record explains; those rows say only what the export says, and speculate about nothing. The bars divide each law’s tracked spending — the dollar figures written into the enacted text as exact amounts — which is not the same as the law’s fiscal size; authorisations, ceilings and pay-fors are excluded, and every category is quoted, item by item, on the bill’s own page — each category name under a bar links straight to its cited items there. Colours follow each bill’s own pie, so a category is the same colour here and on the bill page. 31 bills have been read line by line here; 30 of them carry a recorded roll call. H.R. 4820 was reported by committee and never enacted, so no member holds a position on it. Each position’s link to the official roll call is in How Durbin voted above, and the merged category totals across all of Durbin’s votes are in What Durbin voted to fund.
What none of this can tell you is your state’s share. Not one of the 967 verified spending line items across the 31 bills read line by line here names a state, and none states an allocation formula: the enacted text appropriates to accounts and programmes, not to places. Any per-state figure on this page would therefore have to be modelled by us, and a modelled number under a state flag is not a sourced number. So it is not published, and the gap is printed instead.
What Durbin filed in the 119th Congress
Durbin filed 135 bills and resolutions in the 119th Congress, catalogued by the Congressional Research Service under 26 filing labels. A policy area is a library catalogue term describing what a measure is about as filed. It is not evidence that anything was addressed, improved or affected — and none of these measures carries a money breakdown on this site.
CRS policy area
Measures filed
Share of Durbin’s 135
Crime and Law Enforcement
19
14%
Health
17
13%
Education
16
12%
International Affairs
13
10%
Government Operations and Politics
8
6%
Armed Forces and National Security
5
4%
Environmental Protection
5
4%
Finance and Financial Sector
5
4%
Immigration
5
4%
Public Lands and Natural Resources
5
4%
Taxation
5
4%
Labor and Employment
4
3%
Law
4
3%
Agriculture and Food
3
2%
Commerce
3
2%
Science, Technology, Communications
3
2%
Civil Rights and Liberties, Minority Issues
2
1%
Emergency Management
2
1%
Housing and Community Development
2
1%
Social Welfare
2
1%
Sports and Recreation
2
1%
Animals
1
1%
Energy
1
1%
Families
1
1%
Foreign Trade and International Finance
1
1%
Transportation and Public Works
1
1%
Denominator: Durbin’s own 135 sponsored measures, of which 135 carried a CRS label when the source was built. Sponsoring is not passing, and volume is not effort. Filing labels come from the Congressional Research Service via the govinfo BILLSTATUS bulk data, as of Sept. 20, 2026; the same totals are read independently from the Congress.gov API and the two pipelines agree on all 531 of 531 members compared. The newest of these measures, each linked to congress.gov with its latest action quoted, are listed in the promise ledger above rather than repeated here.
Became law under Durbin’s own number: 0 of 107 law-eligible measures (bills and joint resolutions; simple and concurrent resolutions cannot become law). Congress routinely enacts a measure’s text by folding it into another vehicle, and that enactment is credited to the vehicle’s sponsor, not to this one. A low count — or zero — is therefore not evidence of failure and is not printed as one here.
The 43-day shutdown — Durbin’s record
Funding lapsed at midnight October 1, 2025 and ended November 12, 2025 — 43 days, the longest federal shutdown on record. Congress’s appropriations power makes funding the government its own duty, shared by every member — so every member’s page carries the same record: their recorded votes on H.R. 5371, the funding bill, on both sides of the lapse. Two continuing resolutions were before the Senate during the lapse, and neither could clear a cloture vote for weeks. The Senate rejected funding-advance votes on H.R. 5371 14 times before one was agreed to, and on S. 2882 7 times — both counted the same way from the Senate’s own vote record.
Positions from the chamber’s own roll-call record, staged only after the parsed tallies matched the officially published results exactly. The record states who voted how; it does not assign blame — that judgment is the reader’s.
Total U.S. federal outlays for each fiscal year of Durbin’s current term. That’s the whole federal budget — mostly Social Security, Medicare, defense, interest on the debt, and prior commitments already on the books before this term began — not money Durbin personally directed. A president proposes, Congress appropriates, and no single official controls the total.
Nominal dollars — not adjusted for inflation. Bar lengths compare dollars of different years, so a longer bar can be higher prices rather than more spending. The same bars in comparable money — FY2025 dollars, on the government’s own outlay deflator — run $8.01T in FY2021 to $7.01T in FY2025, and FY2021 is only partly inside this term — the share is marked on that bar. Any two fiscal years, deflated and broken out by what the money bought, are at federal spending by year.
FY21
COVID-19$6.82T74% in term−$2.77T deficit
FY22
COVID-19$6.27T−$1.37T deficit
FY23
COVID-19$6.13T−$1.69T deficit
FY24
$6.74T−$1.82T deficit
FY25
$7.01T−$1.77T deficit
Source: OMB Historical Tables, Table 1.1 (Summary of Receipts, Outlays, and Surpluses or Deficits: 1789-present) · figures · compiled Sept. 21, 2026. Fiscal years run Oct–Sep, so they do not line up with the start of a term — marked above with the share that fell inside this term.
Closed fiscal years published for this term so far: FY2021–FY2025. FY2026 closes Sept. 30, 2026 and OMB has not published it. A short chart here means the term is young and the series stops at the last closed year — not that spending stopped.
How Durbin is graded
A senator’s constituency is the whole state, so Durbin is graded on the same verified state outcomes as the governor — measured as the change on their watch versus the other 49 states, capped because influence is shared with 99 colleagues, Governor JB Pritzker and a world economy. That score is blended with what we can measure of what they personally control: how far the legislation they sponsor actually moves, and — once they hold at least three recorded votes on CBO-scored laws — the deficit footprint of the laws they voted for. Voting alignment is defined in the rubric but reserved, not counted; attendance is counted, from the roll calls the chamber publishes about itself. Every part decomposes on the card above, and the “measured” figure says how much of the grade is real versus still reserved.
Legislative Effectiveness Scores come from the Center for Effective Lawmaking, which benchmarks each chamber’s average to 1.0. The missed-vote and party-line figures are computed by this site from the roll calls the U.S. Senate publishes: every roll call the chamber printed this member’s name on, for this Congress only, with the numerator and denominator shown beside each rate. The roll call records whether a member voted, never why they did not. Independent trackers of the same record are worth reading beside ours — a figure nobody can check against anything is worth less than one that survives comparison: this member on GovTrack, which has tracked Congress independently since 2004 and computes its own figures on its own definitions, so its numbers will not always match these. The Honesty ledger — promises matched against this member’s votes — publishes only with an evidence trail and two agreeing human reviews.